From October through December 2020, we surveyed representative samples of approximately 2,000 center administrators and 3,000 home-based family child care (FCC) providers, as well as a non-probability sample of about 2,500 center-based teaching staff members. Since collecting this rich dataset, we have published several data snapshots and reports.
Click on the provider type to jump to their profile in the page below. You can also download a PDF version of each profile at the top of the page.
Family Child Care (FCC) Providers
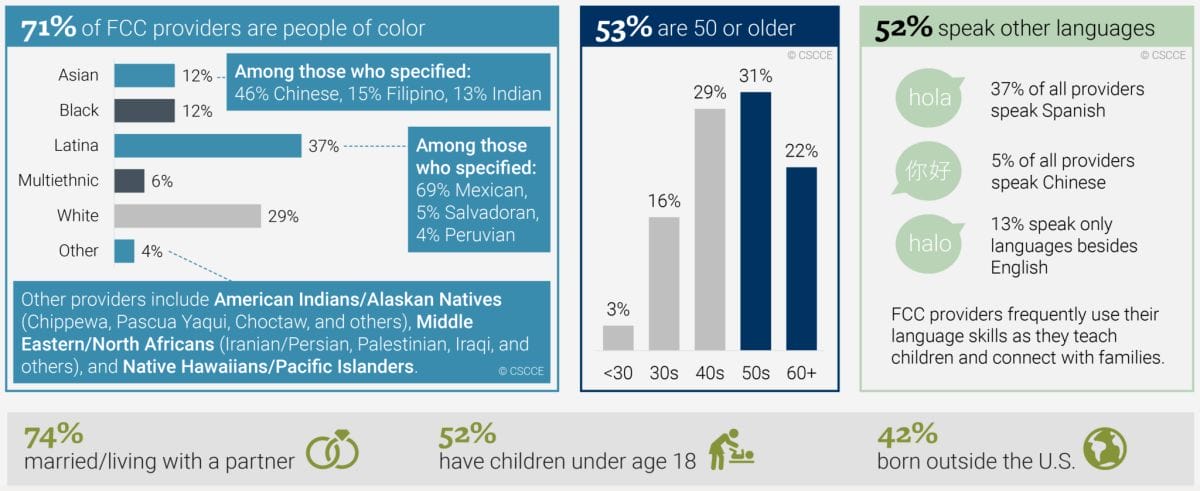
Demographics
There are approximately 24,700 FCC providers in California. Nearly all (98%) are women. Read more.
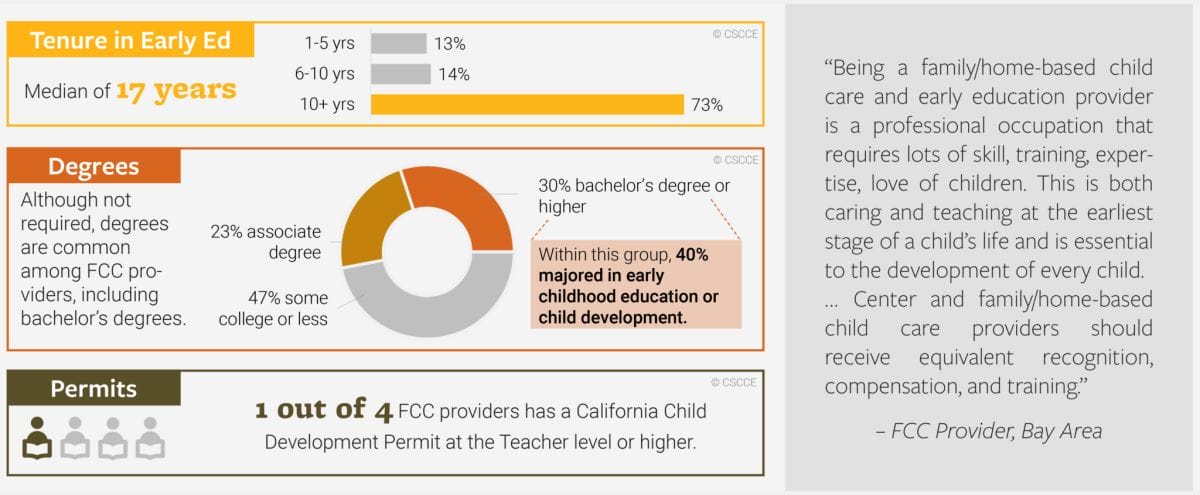
Education and Experience
Most FCC providers have deep experience; many hold degrees. One quarter (24%) belong to a union. Read more.
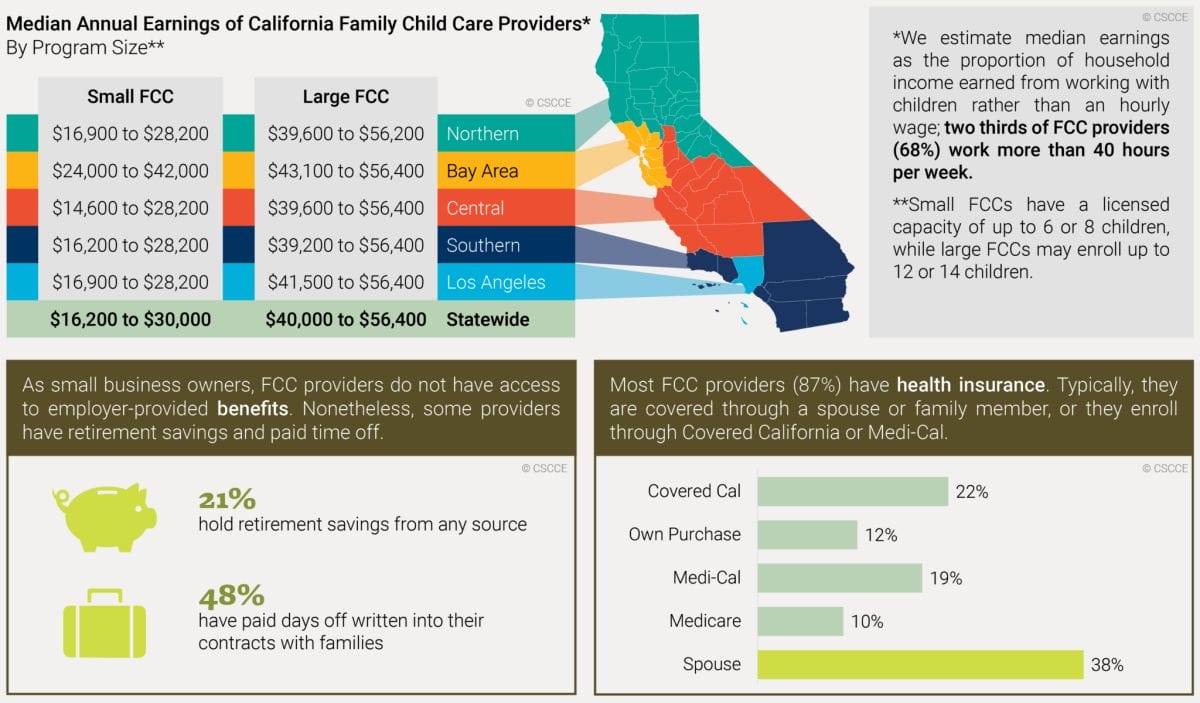
Compensation
Income varies by licensed capacity, region, and more. About one half of FCC providers (48%) earn most or all of their household’s income through work with children. Read the full report.
Economic Well-Being
One third of FCC providers worry that their earnings are not enough to support their family. Read our report.

Child Care Center Teaching Staff
Size of the Workforce
Approximately 83,800 lead teachers and assistants/aides work in child care centers in California. Read more.

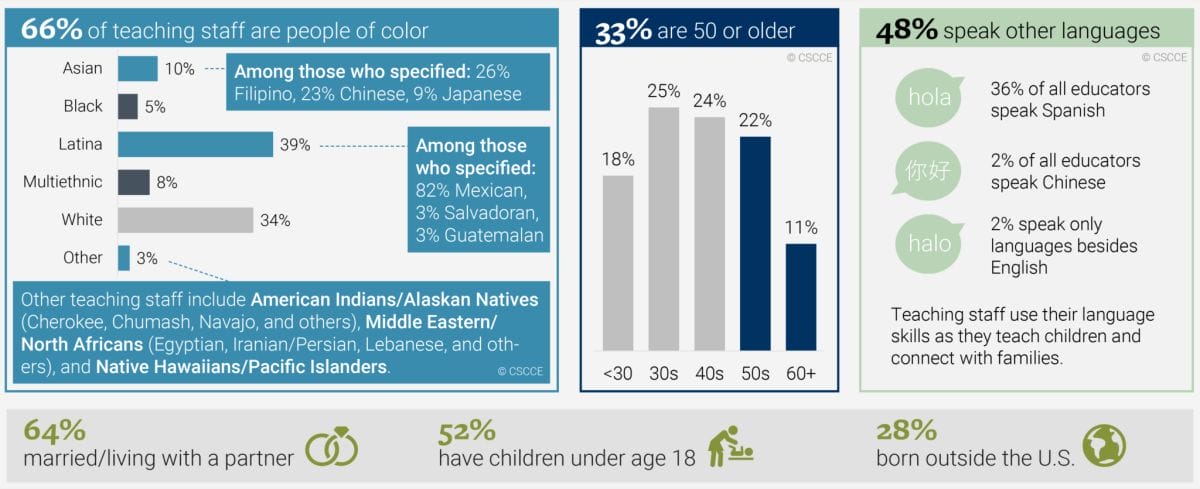
Demographics
Most center teaching staff are people of color (66%). Nearly all (98%) are women. Read more.
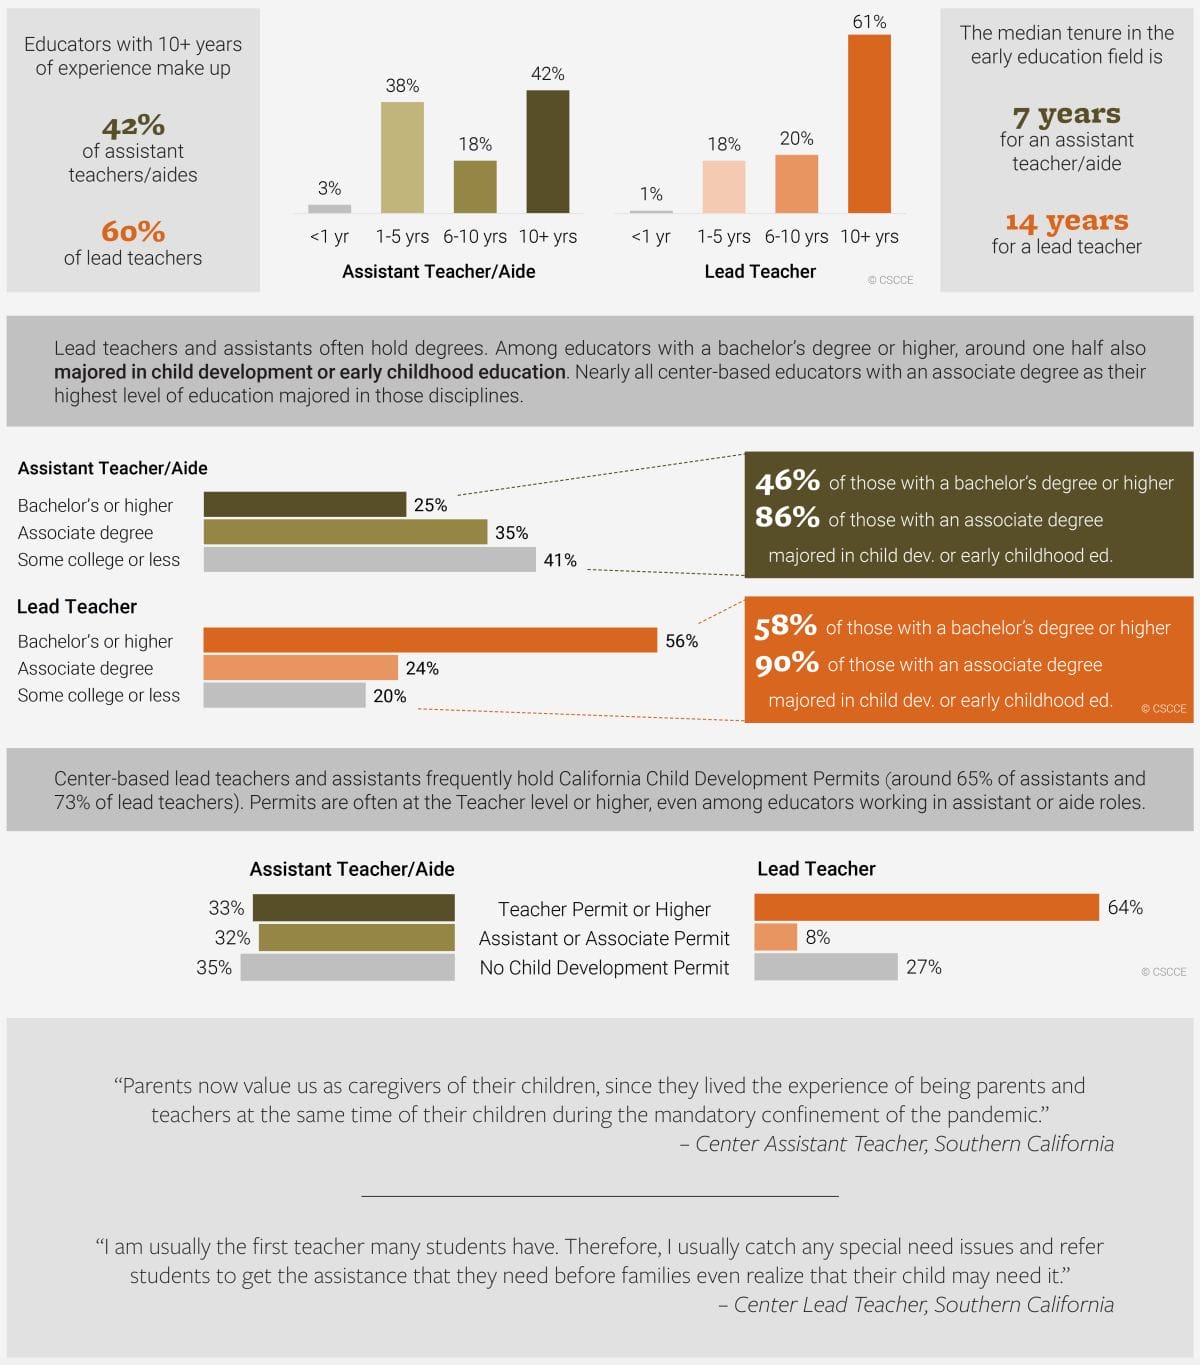
Education and Experience
Many educators have a long tenure in the field and a degree. One quarter (23%) belong to a union. Read more.
Compensation
In 2020, median hourly wages in child care centers were $16 for an assistant teacher and $19 for a lead teacher. The California minimum wage for employers with at least 5 employees was $14. Read the full report.

Economic Well-Being
Two thirds of center teaching staff worry about covering their family’s bills. Read our report.

Child Care Center Directors
Demographics
There are more than 9,500 child care centers in California, each run by a director, site supervisor, or other administrator. Nearly all directors (97%) are women. Read more about their characteristics.

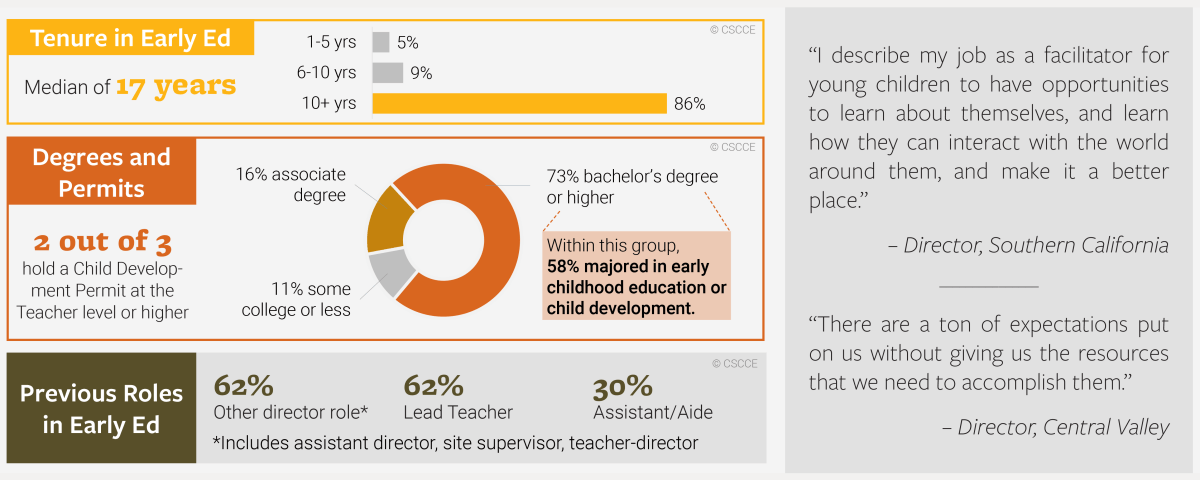
Education and Experience
Most directors have deep experience and hold a bachelor’s degree or higher. Read more.
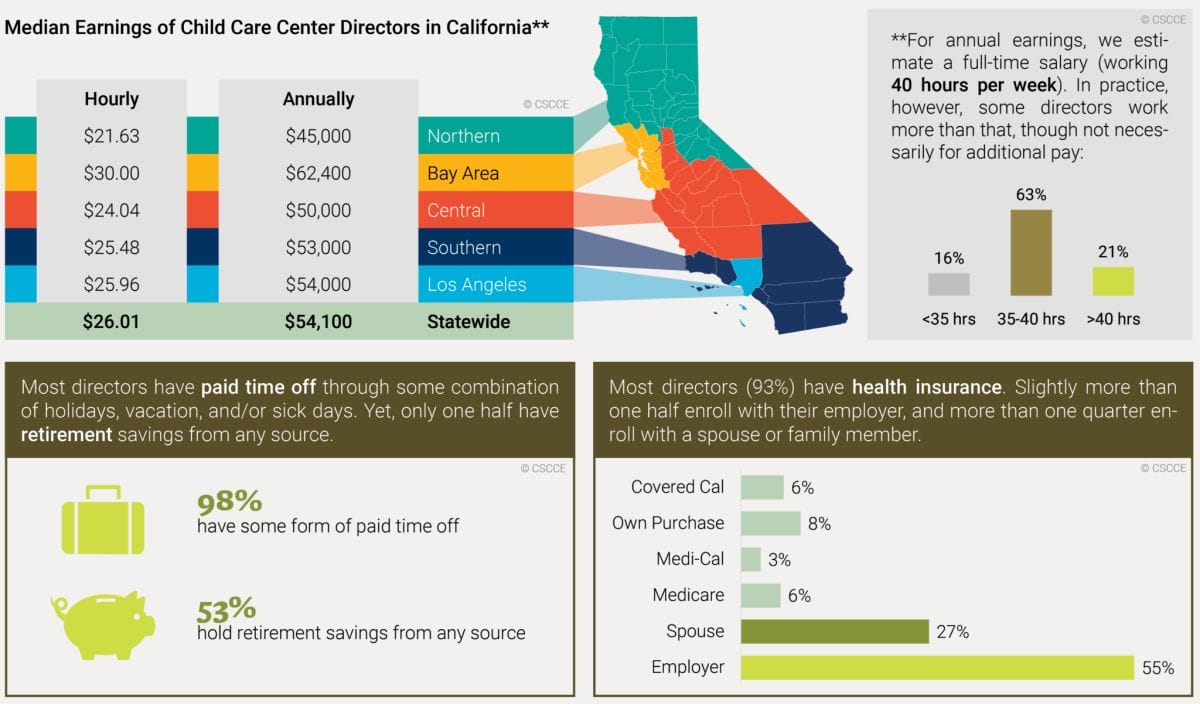
Compensation
Less than one half (41%) of center directors earn most or all of their household’s income through work with children. Read the full report.
Economic Well-Being
About one half (49%) of directors worry about having enough to pay their family’s monthly bills. Read our report.

Suggested Citation
Center for the Study of Child Care Employment. (2022). Profiles of the California Early Care and Education Workforce, 2020. University of California, Berkeley. https://cscce.berkeley.edu/publications/profiles-of-the-california-early-care-and-education-workforce-2020/
Acknowledgements
This factsheet was generously supported by grants from the Heising-Simons Foundation, the David and Lucile Packard Foundation, and the Silicon Valley Community Foundation.
The views expressed in this factsheet are those of the authors and do not necessarily represent collaborating organizations or funders.
Designer: Anna Powell
Editor: Deborah Meacham