This data snapshot features demographics for center directors, family child care providers, and center teachers in California. It is one of a series of releases from CSCCE’s 2020 California Early Care & Education (ECE) Workforce Study, the first comprehensive study of early educators in the state in more than 15 years.
From October through December 2020, we surveyed representative samples of approximately 2,000 center administrators and 3,000 home-based family child care (FCC) providers, as well as non-probability samples of about 2,500 center-based teaching staff members and 280 transitional kindergarten teachers.
Table 1
Table 2
Table 3
Table 4
Methodology
In the California ECE Workforce Study, CSCCE asked individuals to self-identify their age, country of birth, gender, marital status, race/ethnicity, and language fluency. Each of the questions provided the option for the respondent to decline to answer. Non-response falls below 1% per question among those who completed the full survey for age and gender, and remained low for country of birth (5%), marital status (6%), and race/ethnicity (4%). The tables in this snapshot are weighted to adjust for unequal response rates based on underlying program characteristics.
For age, we asked survey respondents to provide their year of birth. We grouped responses by decades.
For country of birth, survey respondents could select either “United States” or “Other,” with the option of a write-in response.
For gender identity, we asked survey respondents to select among the following options. Starred identities are grouped under “All other genders” and sum to less than 1%.
- Woman
- Man
- Transgender *
- Non-binary *
- Prefer to self-describe: [write-in] *
For marital status, we asked survey respondents to select among the options below. All answers besides “Married/Partnered” are grouped under “Unmarried/Single” in this data snapshot.
- Married or living with a partner
- Never married, not living with a partner *
- Separated *
- Divorced *
- Widowed *
For ethnic and/or racial background, we asked survey respondents to select all that applied among the options below, with the option to write in origins. Our forthcoming publications will provide analysis of educators’ write-in responses within each category (for instance, Asian educators who wrote “Chinese” or “Pakistani”). We estimate multiethnic educators by tabulating those who selected two or more ethnic and/or racial backgrounds. Starred items are grouped under “Other.”
- American Indian or Alaska Native *
- Asian
- Black or of African descent
- Hispanic, Latino/a, or Latinx
- Middle Eastern or North African *
- Native Hawaiian or Other Pacific Islander *
- White
- Other race, ethnicity, or origin (please specify): [write-in]
* This snapshot does not provide separate estimates for these educators due to suppression of small cell sizes.
** Because the early care and education workforce is overwhelmingly comprised of women, we use the gender-specific term “Latina” in our table to describe members of the ECE workforce who identify as Hispanic, Latino/a, or Latinx.
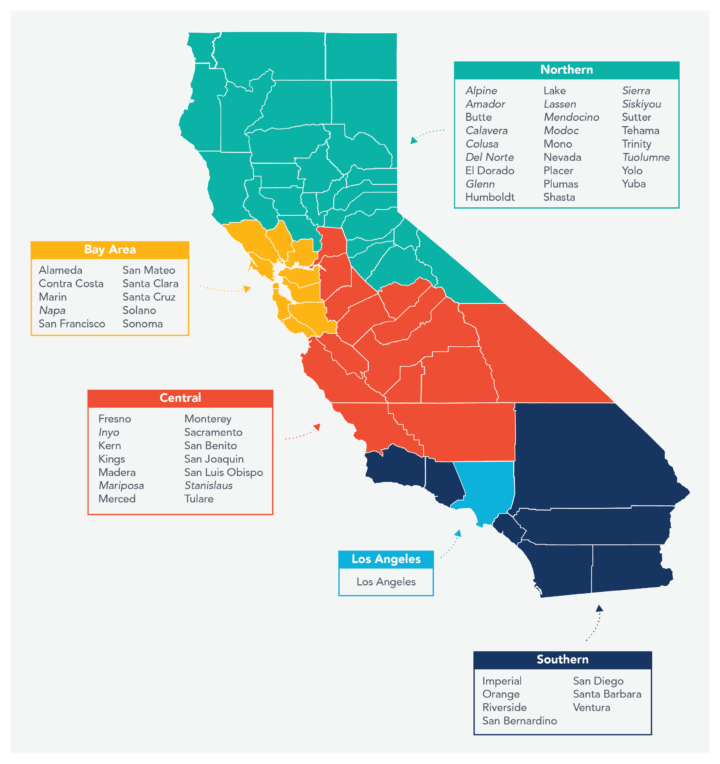
Regional Map of California
Suggested Citation
Powell, A., Kim, Y., & Montoya, E. (2021). Demographics of the California ECE Workforce. Center for the Study of Child Care Employment, University of California, Berkeley. https://cscce.berkeley.edu/publications/data-snapshot/demographics-of-the-california-ece-workforce/
Acknowledgements
The 2020 California Early Care and Education Workforce Study is a multiyear project generously supported by First 5 California, the California Department of Education, the Heising-Simons Foundation, and the David and Lucile Packard Foundation and implemented in partnership with the California Child Care Resource & Referral Network.