Early Educator Pay & Economic Insecurity Across the States
The majority of early educators view their work as a personal calling or career, but their contributions are undervalued, both socially and financially.1Paschall, K., Ekyalongo, Y.Y., & Padilla, C.M. (2023). Professional Characteristics of the Center-based Child Care and Early Education Workforce in 2012 and 2019: Descriptions by Race and Ethnicity,Languages Spoken, and Nativity Status. OPRE Report #2023-205. https://www.acf.hhs.gov/sites/default/files/documents/opre/2023-205%20Workforce%20Demographics%20snapshot.pdf. Most early care and education (ECE) is funded through a broken market-based system: parents struggle to afford payments, programs are unable to raise prices, and early educator pay remains low. The results are staggering: the median wage in early care and education falls below 97 percent of all other occupations.
These tensions have deep roots in our nation’s history. In the United States, the profession of nurturing and teaching children traces back to the forced labor of enslaved Black women.2 For a detailed exploration of the history of child care in our country, visit the Early Childhood History, Organizing, Ethos and Strategy (ECHOES) website, a project of the Center for the Study of Child Care Employment, at https://cscce.berkeley.edu/projects/echoes/; Lloyd, C.M., Carlson, J., Barnett, H., Shaw, S., & Logan, D. (2021). Mary Pauper: A historical exploration of early care and education compensation, policy, and solutions. Child Trends. https://earlyedcollaborative.org/what-we-do/mary-pauper/. Today, much of the work in early care and education continues to be performed by Black women, Latina women, and other women of color, who already face compounded forces of inequity based on their intersectional identities of race, gender, and country of birth.
In addition to low overall wages in the sector, the piecemeal approach to public funding reinforces disparities in pay within the field. Educators holding equivalent educational degrees face different wage levels depending on the location of their employment, the age of the children they serve, and their racial and ethnic backgrounds.
Early Educator Pay
The work of teaching and caring for young children is highly skilled and complex, yet employment in early care and education has largely failed to generate wages that allow early educators to meet their basic needs. Instead, this career has been a pathway to poverty for many early educators, compromising not only their financial stability, but also their physical and mental well-being.3 Muruvi, W., Powell, A., Kim, Y., Copeman Petig, A., & Austin, L.J.E. (2023). The Emotional and Physical Well-Being of Early Educators in California. Early Educator Well-Being Series. Center for the Study of Child Care Employment, University of California, Berkeley. https://cscce.berkeley.edu/publications/report/ca-emotional-physical-wellbeing-2023/.
“We are professionals and should be treated in that manner in all aspects of our employment…. The ECE workforce needs to be on the same scale as public K-12 teachers in terms of wages and benefits.”
Early Educator Wages Remain Low Across States
Nationally, early educators earn a median wage of $13.07 per hour (Figure 2.2.1). Hourly wages vary by location, ranging from $10.60 in Louisiana to $18.23 in Washington, D.C. For detailed state-by-state estimates, please refer to our map in the State Explorer and our data tables in Appendix 2.
We estimate these wages using the American Community Survey (ACS), conducted by the U.S. Census Bureau.5 Authors’ analysis of American Community Survey public use microdata, retrieved from IPUMS USA (https://doi.org/10.18128/D010.V14.0). The four groups of educators shown in Figure 2.2.1 reflect the classifications used in the ACS. While early educators tend to use labels like “family child care educator,” “infant-toddler teacher,” or “center site supervisor,” we do not find these options in the ACS; instead, they use only “childcare worker,” “preschool teacher,” “assistant teacher,” and “administrator,” and it is not clear what type of program they work in. However, we can still gather useful information about the wages of the ECE workforce by using the categories in the ACS.
Within the ECE workforce, those identified as teaching assistants and child care workers in ACS data earn the lowest median wages ($11.88 per hour and $11.81 per hour, respectively). Preschool teachers earn slightly more ($13.74 per hour), and directors or administrators have the highest median wage ($20.38 per hour).
Figure 2.2.1.
Median Hourly Wages, By Occupation, 2022

Using American Community Survey Data to Measure Wages
We estimate wages in the 2024 Index using data from the U.S. Census Bureau’s 2022 American Community Survey (ACS)—a departure from previous editions of the Index, which reported analysis of data from the Occupational Employment and Wage Statistics (OEWS) of U.S. Bureau of Labor Statistics. The most recent year for which detailed state-by-state data are available from the ACS is 2022.
Our use of the ACS is an intentional change to better quantify the wages and well-being of the ECE workforce, particularly by including home-based providers. In contrast, while more recent data from 2023 are available from the OEWS, that source uses employer-reported data and excludes self-employed workers like family child care (FCC) providers. To explicitly estimate FCC earnings, researchers sometimes analyze self-employed child care workers in the ACS.1Herzenberg, S., Price, M., & Bradley, D. (2005). Losing Ground in Early Childhood Education: Declining Workforce Qualifications in an Expanding Industry 1979-2004. Economic Policy Institute. https://files.epi.org/page/-/old/studies/ece/losing_ground-full_text.pdf. We estimate the median wage for this group was $9.01 per hour or approximately $18,500 per year in 2022.2Authors’ analysis of American Community Survey public use microdata, retrieved from IPUMS USA (https://doi.org/10.18128/D010.V14.0). We use the CLASSWKRD variable to identify the subset of occupation code 4600 (child care workers) in our four-industry frame who are self-employed and unincorporated. For more information on our definition of the ECE workforce in the ACS, including the occupation-industry code schema we use, refer to the Methods section in Appendix 1: Data Sources & Methodology. However, we are unable to determine if self-employed child care workers found in the ACS are all FCC providers, as this data source cannot be broken down by setting. Therefore, we do not use this method to estimate FCC provider wages at the state level.
The ACS data also allow us to create a combined “early childhood educator” or “ECE workforce” category, rather than perpetuate a false dichotomy between “child care” and “preschool.” OEWS data does not allow us to parse or combine the occupational classifications used for early care and education, which continue to separate early childhood educators into “childcare workers” and “preschool teachers,” as if these were mutually exclusive occupations. Indeed, the ECE workforce performs similar tasks across settings (schools, centers, and homes) and funding streams (Head Start, pre-K, child care subsidies).3Workgroup on the Early Childhood Workforce and Professional Development. (2016). Proposed Revisions to the Definitions for the Early Childhood Workforce in the Standard Occupational Classification. OPRE Report 2016-45. Office of Planning, Research and Evaluation, Administration for Children and Families, U.S. Department of Health and Human Services. https://www.acf.hhs.gov/sites/default/files/documents/opre/soc_white_paper_june_2014_518_508.pdf For example, the OEWS national estimates for median wages in 2023 were $14.60 for child care workers, $17.85 for preschool teachers, and $26.10 for directors or administrators.4Bureau of Labor Statistics, U.S. Department of Labor, Occupational Employment and Wage Statistics. www.bls.gov/oes/.
In previous editions of the Index, we used Bureau of Labor Statistics data for estimates of educator wages and consulted different data sources to estimate wages and poverty. As of the 2024 Index, we can streamline our approach and avoid using data with different sampling methods. Because of this change, however, readers should not compare wage data in the 2024 Index with prior years.
For more information, refer to the Methods section in Appendix 1: Data Sources & Methodology.
When we compare wages in early care and education to wages in more than 500 other occupations, we find that the ECE workforce as a whole ranks at the third percentile for annual earnings. To understand what this means, imagine a group of 500 individuals, each representing a different occupation in the United States (for instance, gardener, bus driver, nurse). If the group were to line up in order of their annual salary with the lowest salary in the front, only 3 percent of the representatives would stand ahead of the woman representing early care and education—and 97 percent of them would stand behind her, because their annual earnings are higher (Figure 2.2.2).
We can expand this visual further. Rather than having one worker representing the ECE workforce, we could include four using the categories in the ACS: a teaching assistant, a child care worker, a preschool teacher, and a director. Among these four workers, there would be some slight differences: the teaching assistant and child care worker would be even closer to the front of the line (both around the second percentile), while the preschool teacher would stand a few places further back (the fifth percentile). By comparison, a teacher representing elementary and middle school education would stand at the 63rd percentile, and a high school teacher would stand at the 71st percentile.
Figure 2.2.2.
Ranking of Median Hourly Wages in ECE and K-12 Education, 2022
Early Educator Wage Growth Lags Behind Fast Food and Retail Wages
Since the publication of the 2020 Index, real wages have risen approximately 4.9 percent across all occupations nationwide (Figure 2.2.3). We derive this estimate by comparing inflation-adjusted data from 2017-2019 and 2020-2022. Early educators saw a similar increase in wages (4.6 percent), in contrast to elementary and middle school teachers whose wages dropped (-2.0 percent). However, compared to other low-wage occupations, ECE wage growth lagged behind: fast food workers experienced a 5.2-percent increase, and retail salespersons experienced a 6.8-percent increase. These findings echo analyses from the National Women’s Law Center and the Economic Policy Institute.6 National Women’s Law Center. (2023). Early Educators’ Wage Growth Lagged Behind Other Low-Paid Occupations, Jeopardizing the Supply of Child Care as Relief Dollars Expire. https://nwlc.org/wp-content/uploads/2023/07/ChildCareDollarsFS.pdf; Gould, E., & deCourcy, K. (2023). Low-wage workers have seen historically fast real wage growth in the pandemic business cycle. Economic Policy Institute. https://www.epi.org/publication/swa-wages-2022/.
Figure 2.2.3.
Percent Change in National Median Wage Between 2019 and 2022, By Occupation
Wage growth varied substantially at the state level (Figure 2.2.4). States like Texas and Massachusetts followed a pattern similar to the nation as a whole: early educators saw wages rise, while elementary and middle school teachers experienced a decline. Ten states, including Louisiana and Oklahoma, saw early educator wages fall (by 7.4 percent and 5.9 percent, respectively). Yet in contrast, in those same two states, wages across all occupations rose (3.9 percent and 2.1 percent, respectively). At the other end of the spectrum, the District of Columbia and nine states, including Utah, saw an increase in ECE wages of more than 10 percent, outpacing wage growth across the state as a whole. To review changes for all states, refer to the State Explorer Maps and Appendix 2.5.
Figure 2.2.4.
Percent Change in Median Wage in Five States Between 2019 and 2022, By Occupation
Early Educators Do Not Earn a Living Wage in Any State
Everyone working with young children should earn at least a livable wage, which is higher than current minimum wage levels. Yet, the median early educator wage in every state falls below a living wage for a single adult with no children. Although what counts as “livable” is not universally agreed upon, standards do exist and are calculated based on the ability to afford basic necessities in a given community. For example, the Massachusetts Institute of Technology (MIT) Living Wage Calculator “draws upon geographically specific expenditure data related to a family’s likely minimum food, child care, health insurance, housing, transportation, and other basic necessities (e.g., clothing, personal care items, etc.) costs [...] and the rough effects of income and payroll taxes to determine the minimum employment earnings necessary to meet a family’s basic needs while also maintaining self-sufficiency.”7 Glasmeier, A.K. (2023). Living Wage Calculator. Massachusetts Institute of Technology. https://livingwage.mit.edu/.
Living wages vary by household type as well as by state, given differences in the cost of living. Figure 2.2.5 reports the gap between current wages and living wages in each state. In 2020, we estimated that educators in 10 states would meet or exceed this threshold (Alaska, Arizona, Colorado, Maine, Minnesota, Nebraska, North Dakota, Vermont, Washington, and Wyoming). However, our 2024 estimates rely on American Community Survey data, which include home-based providers who were not covered in our previous analyses. As a result, we now find that in every state, the median ECE wage falls below the living wage for a single adult with no children.
In every state, the median ECE wage falls below the living wage for a single adult with no children.

Figure 2.2.5.
Living Wage Gap for the ECE Workforce, By State, 2022
Some differences in the size of the living wage gap are noteworthy. The gap is smallest in New Hampshire, where the median early educator wage is only 8 percent below the living wage; Rhode Island and Connecticut come next, each with a 10-percent gap. In three states, the gap is more than five dollars (Hawaii, New York, and Georgia). Hawaii has the largest living wage gap, at 32 percent. Figure 2.2.6 compares the living wage gap in five states in both percents and dollars, ranging from the smallest gap ($1.25 in New Hampshire) to the largest gap ($6.57 in Hawaii).
Figure 2.2.6.
Living Wage Gap for the ECE Workforce in Five States, 2022
Figure 2.2.6 compares wages in early care and education to the living wage for a single adult with no children, yet many early educators are parents. These educators experience a much deeper living wage gap; for instance, an early educator with a child of their own faces a living wage gap of $18.87 in New Hampshire and $26.97 in Hawaii. For more information on living wages for early educators (with and without children), refer to the State Explorer maps and the Appendix 2 data tables.
Early Educators Lack Employer-Sponsored Benefits
Access to benefits like health insurance and retirement are vital but not always available from ECE employers—and family child care providers don’t receive benefits at all, unless they purchase them out of their earnings. Not only do many educators rely on Medicaid to access health insurance for themselves and their children, but they may also turn to food banks and public safety net programs in order to get by.
Rates of early educators without health insurance exceed the national average.8 Amadon, S., Maxfield, E., Simons Gerson, C., & Keaton, H. (2023). Health Insurance Coverage of the Center-Based Child Care and Early Education Workforce: Findings from the 2019 National Survey of Early Care and Education. OPRE Report #2023-293. Office of Planning, Research, and Evaluation, Administration for Children and Families, U.S. Department of Health and Human Services. There is one crucial exception: educators working in public schools, where collective bargaining agreements typically cover both health and retirement. Retirement savings are even more rare as an employer-sponsored benefit. When an employer does offer some sort of retirement benefit, uptake is typically low because employees frequently can’t afford to participate.9 Lucas, K.D. (2023). Retirement for early educators: Challenges and possibilities. Federal Reserve Bank of Boston. https://www.bostonfed.org/-/media/Documents/Community-Development-Issue-Briefs/cdbrief12023.pdf.
“Educators are choosing between making a living and having health care.”
A recent brief from the National Association for the Education of Young Children (NAEYC) underscores the importance of including benefits in compensation policies for early educators. The NAEYC brief demonstrates, however, that some states have already taken steps to fund not only health and retirement benefits, but the costs of higher education and housing, as well.11 National Association for the Education of Young Children. (2024). Compensation Means More Than Wages: Increasing Early Childhood Educators’ Access To Benefits. https://www.naeyc.org/sites/default/files/wysiwyg/user-73607/naeyc_benefits_brief.may_2024.pdf.
California: Benefits for Home-Based Providers
Using data from our statewide survey conducted in 2020,5Montoya, E., Austin, L.J.E., Powell, A., Kim, Y., Copeman Petig, A., & Muruvi, W. (2022). Early Educator Compensation: Findings from the 2020 California Early Care and Education Workforce Study. Center for the Study of Child Care Employment, University of California, Berkeley. https://cscce.berkeley.edu/publications/report/early-educator-compensation/. CSCCE estimated the availability of health care and retirement benefits for early educators in California. We found that center-based educators had similar rates of health coverage as the rest of the state, while FCC providers were somewhat more likely to be uninsured (for instance, 12 percent of educators with a small FCC license compared to 8 percent of all workers). While seven out of ten child care centers offered healthcare benefits, participation in Medi-Cal (California’s Medicaid program) was frequently the only option for FCC providers, besides coverage under the plan of a spouse or other family member. In a 2023 follow-up survey, we also found that many early educators experienced anxiety, depression, and chronic health conditions.6Muruvi, W., Powell, A., Kim, Y., Copeman Petig, A., & Austin, L.J.E. (2023). The Emotional and Physical Well-Being of Early Educators in California. Early Educator Well-Being Series. Center for the Study of Child Care Employment, University of California, Berkeley.
With regard to retirement benefits, both center- and home-based early educators fell behind the workforce as a whole: only 50 percent of lead teachers had any retirement savings, along with only 21 percent of FCC providers in the state. By comparison, roughly two thirds of workers throughout the United States have retirement savings.
Since the 2020 survey, advocacy for increasing benefits to FCC providers has taken root. Child Care Providers United, the union representing home-based early educators enrolling state-subsidized children, successfully negotiated for an $80-million retirement fund as part of its most recent contract, as well as a $100-million health insurance fund.7Child Care Providers United. (2023). Child Care Providers United Contract. https://childcareprovidersunited.org/. These new investments are groundbreaking, though providers who do not enroll subsidized children are not eligible to participate.
To learn more about the wages and benefits for the California ECE workforce, check out our Findings from the 2020 California Early Care and Education Workforce Study.8Montoya, E., Austin, L.J.E., Powell, A., Kim, Y., Copeman Petig, A., & Muruvi, W., (2022). Early Educator Compensation: Findings from the 2020 California Early Care and Education Workforce Study. Center for the Study of Child Care Employment, University of California, Berkeley. https://cscce.berkeley.edu/publications/report/early-educator-compensation/.
Early Educator Economic Well-Being
Low wages and insufficient access to benefits like health insurance and retirement have stark consequences for early educators. Not only do early educators experience poverty more often than teachers of older children, but they also have greater food insecurity and higher participation rates in public safety net programs.
Poverty Among Early Educators Is Nearly Six Times Higher Than Among Elementary School Teachers
Early educators’ low wages result in poverty rates that are 5.7 times higher than those of elementary and middle school teachers. Specifically, around 13.1 percent of early educators earn below the federal poverty line, compared to only 2.3 percent of elementary and middle school teachers.
“Most early educators have to work a second job. Educators are at poverty level. This is unacceptable."
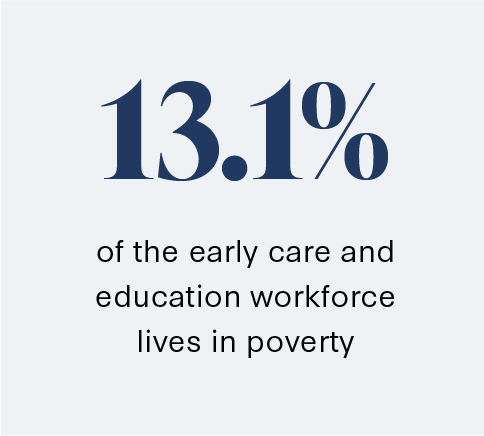
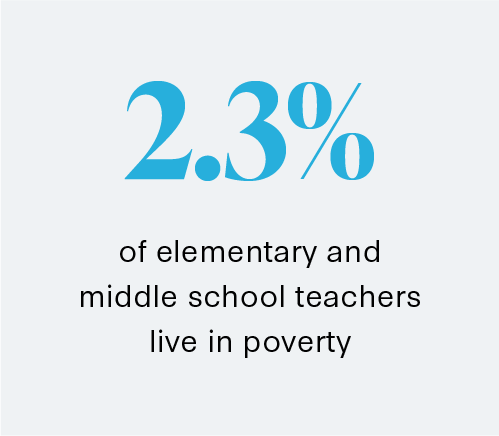
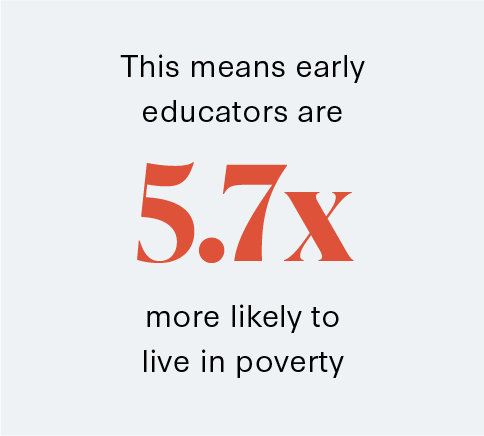
Figure 2.2.7 shows how poverty rates for the ECE workforce vary by state. In addition to viewing poverty rates in the State Explorer Maps, you can review the complete data tables in Appendix 2.8. Four states (Delaware, Vermont, Alaska, and New Hampshire) have early educator poverty rates of less than 10 percent. On the other hand, Mississippi and the District of Columbia have poverty rates greater than 20 percent. These findings, however, reflect data from 2018-2022. The District of Columbia established the Early Childhood Educator Pay Equity Fund during this period, but payments only began to flow in late 2022.13 Office of the State Superintendent of Education. (2024). Early Childhood Educator Pay Equity Fund. https://osse.dc.gov/ecepayequity. This initiative represents a complete transformation of early educator compensation in the nation’s capital.
Figure 2.2.7.
Poverty Rates for Early Educators, By State, 2022
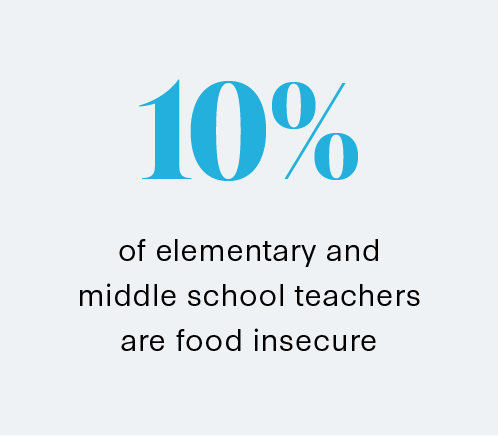
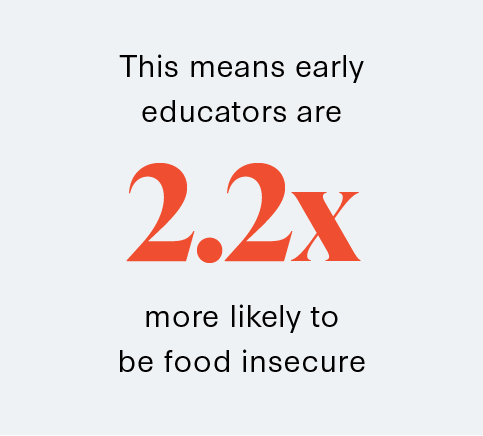
Early Educators Are More Than Twice as Likely to Be Food Insecure Than Elementary and Middle School Teachers
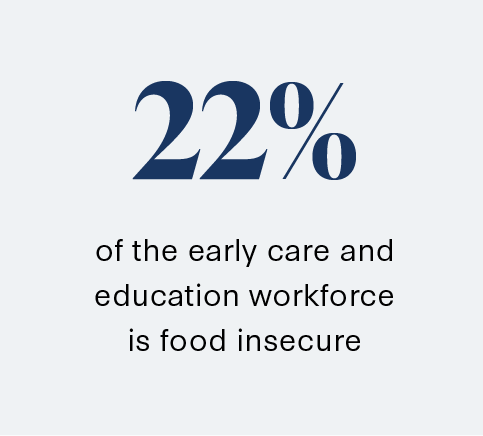
Food insecurity is another outcome of insufficient wages. Approximately 22 percent of early educators are food insecure, as estimated by the Current Population Survey Food Security Supplement.14 Authors’ analysis of public use microdata, retrieved from IPUMS CPS (Flood, S. King, M., Rodgers, R., Ruggles, S., Warren, J.R., Backman, D., Chen, A., Cooper, G., Richards, S., Schouweiler, M., & Westberry, M. [2023]. IPUMS CPS: Version 11.0 [dataset]. IPUMS. https://doi.org/10.18128/D030.V11.0). Note: This dataset is too small to support state-level analysis, so we limit our estimates to the national level. In other words, early educators are more than twice as likely to be food insecure compared to teachers in elementary and middle schools.
Early Educators Face Profound Economic Insecurity
In order to counter food insecurity and other economic challenges for themselves and their families, many early educators participate in public safety net programs. Programs like Medicaid, the Earned Income Tax Credit (EITC), and the Supplemental Nutrition Assistance Program (SNAP) can help educators mitigate the effects of insufficient wages. Very few educators (less than 1 percent) participate in Temporary Assistance for Needy Families (TANF), which serves very few people in general. Overall, an estimated 43 percent of early educators participate in at least one of these public safety net programs. There are minor differences among groups within the ECE workforce: for example, 41 percent of preschool teachers participate in one or more programs, compared to 46 percent of child care workers and 47 percent of teaching assistants.
Figure 2.2.8 shows how early educators compare to elementary and middle school teachers as well as to the workforce as a whole. These estimates derive from the Public Cost Model, an analysis produced by the UC Berkeley Center for Labor Research and Education (Labor Center).15 Public safety net data are calculated using the Public Cost Model developed by the Labor Center at
the University of California, Berkeley. To read more about the model, see Jacobs, K., Huang, K., MacGillvary, J.,& Lopezlira, E. (2022). The Public Cost of Low-Wage Jobs in the US Construction Industry. The Labor Center, University of California, Berkeley. https://laborcenter.berkeley.edu/the-public-cost-of-low-wage-jobs-in-the-US-construction-industry/.
For more information on public assistance nationally and a detailed explanation of safety net data sources, refer to the Methods section in Appendix 1: Data Sources & Methodology.
Figure 2.2.8.
Early Educators Participating in Public Safety Net Programs, 2021
By paying early educators low wages, programs avoid raising the prices they charge parents. Yet, the long-term costs of paying educators a living wage is merely shifted: taxpayers invest more than $4.7 billion per year in public safety net expenses to early educators' families to offset their insufficient earnings.
U.S. taxpayers invest more than $4.7 billion per year in public safety net expenses to early educators' families to offset their insufficient earnings.
The Labor Center’s analysis also provides a look at public safety net participation in 22 states. Figure 2.2.9 shows the results from five of these states, including the state with the lowest rate of public safety net program participation for early educators (Minnesota, where 31 percent of early educators participate in at least one public safety net program) and the state with the highest (New York, where 50 percent participate). The full set of findings for the 22 states is included in Appendix 2.10.
Figure 2.2.9.
Early Educator Families Participating in Public Safety Net Programs in Five States, 2021

Pay Disparities Within ECE
While the entire early care and education field struggles with low pay, disparities are found within the sector. Early educators’ wages vary considerably based on their location of employment and the ages of children they serve, even when holding equivalent educational degrees.16 National Survey of Early Care and Education Project Team. (2013). Number and Characteristics of Early Care and Education (ECE) Teachers and Caregivers: Initial Findings from the National Survey of Early Care and Education (NSECE). OPRE Report #2013-38. Office of Planning, Research and Evaluation, Administration for Children and Families, U.S. Department of Health and Human Services; Montoya, E., Austin, L.J.E., Powell, A., Kim, Y., Copeman Petig, A., & Muruvi, W. (2022). Early Educator Compensation: Findings From the 2020 California Early Care and Education Workforce Study. Center for the Study of Child Care Employment, University of California, Berkeley. https://cscce.berkeley.edu/publications/report/early-educator-compensation/#:~:text=Income%20and%20Wages,of%20center%20teachers%20and%20directors. While ACS data can provide a picture of earnings in early care and education, it is not possible to identify workers in different ECE settings like Head Start or public pre-K. Fortunately, the 2019 National Survey of Early Care and Education17 National Survey of Early Care and Education. (2019). Office of Planning, Research and Evaluation, Administration for Children and Families, U.S. Department of Health and Human Services. https://www.acf.hhs.gov/opre/project/national-survey-early-care-and-education-2019-2017-2022. allows us to compare wages for center-based teaching staff by program funding and sponsorship, ages of children served, and educators’ racial and ethnic backgrounds.18 National Survey of Early Care and Education Project Team. (2013). Number and Characteristics of Early Care and Education (ECE) Teachers and Caregivers: Initial Findings from the National Survey of Early Care and Education (NSECE). OPRE Report #2013-38. Office of Planning, Research and Evaluation, Administration for Children and Families, U.S. Department of Health and Human Services. Due to the study sample size, however, we are not able to look at these data for all states.
Figure 2.2.10 shows that educators working in centers with public funding are paid higher wages than those employed in centers without public funding. Among center-based teaching staff who hold a bachelor’s degree or higher, those working in school-sponsored pre-K programs were paid more than $20,000 more per year compared to educators working in centers without public funding.
The pay penalty for working with younger children persists in the recent NSECE data and was well documented in our earlier work.19 Austin, L.J.E., Edwards, B., Chávez, R., & Whitebook, M. (2019). Racial Wage Gaps in Early Education Employment. Center for the Study of Child Care Employment, University of California, Berkeley. https://cscce.berkeley.edu/publications/brief/racial-wage-gaps-in-early-education-employment/. McLean, C., Austin, L.J.E., Whitebook, M., & Olson, K.L. (2021). Early Childhood Workforce Index – 2020. Center for the Study of Child Care Employment, University of California, Berkeley. https://cscce.berkeley.edu/workforce-index-2020/. Among center-based teaching staff with a bachelor’s degree or higher working in other ECE centers, early educators working only with infants and toddlers are paid about $8,000 per year less than those working exclusively with children age three to five, not yet in kindergarten.
Figure 2.2.10.
Mean Annual Salary for Center-Based Teaching Staff With at Least a Bachelor’s Degree, By Program Funding/Sponsorship and Age of Children Served, 2019
The absence of a coherent wage structure—a framework that considers factors such as education, experience, and job role—also fosters disparities in ECE wages across racial and ethnic lines. Figure 2.2.11 shows that Black and Latina center-based teaching staff are paid lower wages than their Asian and White colleagues, even when holding equivalent educational degrees. The wage gaps between Black and White educators, for example, amount to an average of more than $8,000 per year.
White early educators earn an average of $8,000 more per year than Black early educators.
We found that White educators were paid significantly higher wages than Black educators even after controlling for job roles (whether in aide/assistant or teacher positions) and regional locations (four regions based on the U.S. Census Bureau).
“Value us, value us in our wages.”
Figure 2.2.11.
Mean Annual Salary for Center-Based Teaching Staff With at Least a Bachelor’s Degree, By Race and Ethnicity, 2019
Continue reading →
Next Chapter: State Policies to Improve Early Childhood Educator Jobs


